Speech Enhancement using Generative Dictionary Learning
Christian D. Sigg, Member, IEEE, Tomas Dikk and Joachim M. Buhmann, Senior Member, IEEE
This page provides complementary material for our paper on speech enhancement using generative dictionary learning, published in the IEEE Transactions on Audio, Speech and Language Processing, vol. 20, no. 6, 2012.
Website Contents
Speech Enhancement Performance | Example Spectrograms | Downloads
Speech Enhancement Performance
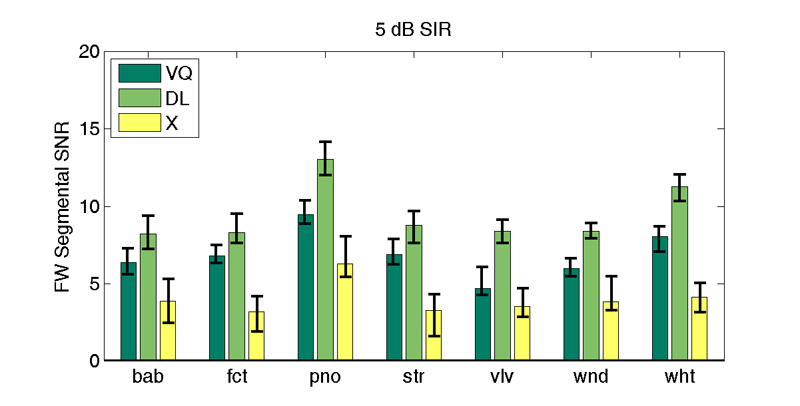
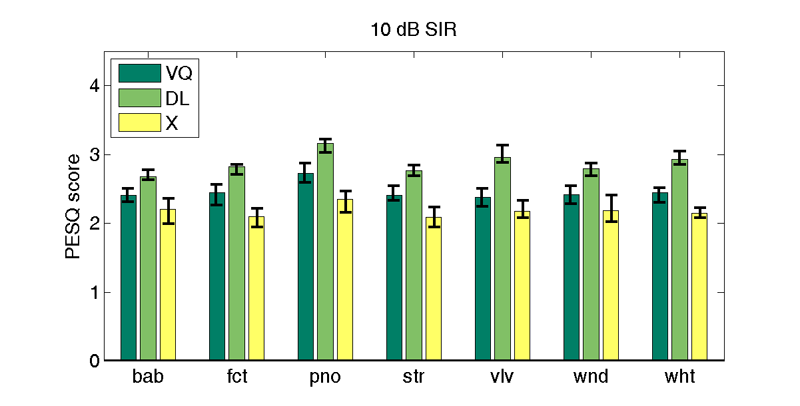
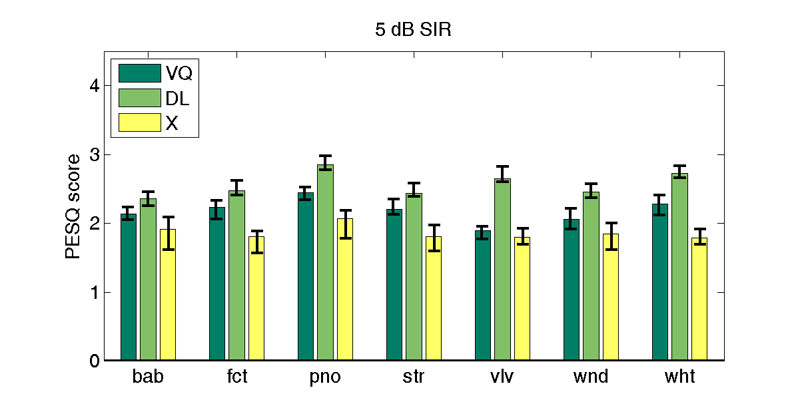
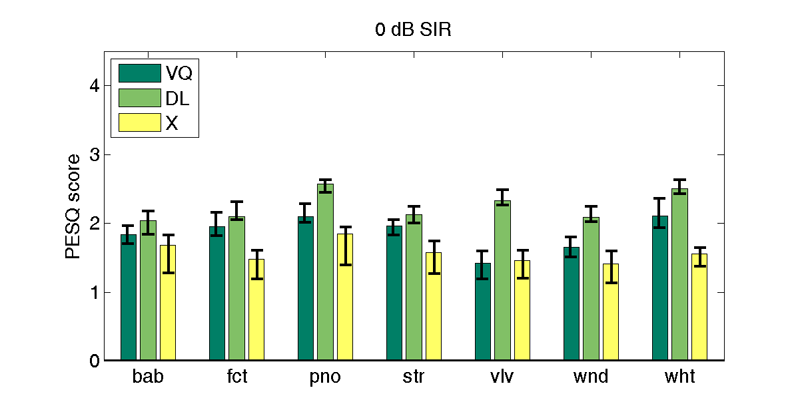
We report speech enhancement performance using two different objective measures, frequency-weighted segmental SNR (fwSegSNR) and PESQ, in both the speaker independent and speaker dependent case, for A-weighted signal-to-interferer ratios (SIRs) ranging from 10dB to 0dB.
The performance is measured as follows: for each method, the processed (enhanced) speech signal is compared to the clean speech signal using the reported objective measure. For comparison, the original degraded speech signal is compared to the clean speech signal. This is done with 30 test mixtures and the median performance is reported. An improvement is deemed significant if the median value of the objective measure for the enhanced signal exceeds the 75th percentile of the degraded speech signal.
In the case of the fwSegSNR measure, a graphical representation of the performance is provided, along with a numerical representation and example audio files. In the case of the PESQ measure, a graphical representation of the performance is provided, along with a numerical representation.
Interferer Types
| bab | Speech babble noise |
| fct | Machine noise in a factory |
| pno | Piano music replayed indoors |
| str | Street traffic noise |
| vlv | Engine and tire noise in a Volvo car |
| wnd | Wind noise |
| wht | Gaussian white noise |
Enhancement Methods / Plot and Table Legend
| X | Unprocessed (degraded) speech signal |
| GA | Geometric spectral subtraction |
| VQ | Codebook-based filtering (VQi: speaker independent, VQd: speaker dependent) |
| DL | Our method (DLi: speaker independent, DLd: speaker dependent) |
Frequency-Weighted Segmental SNR - Speaker Independent
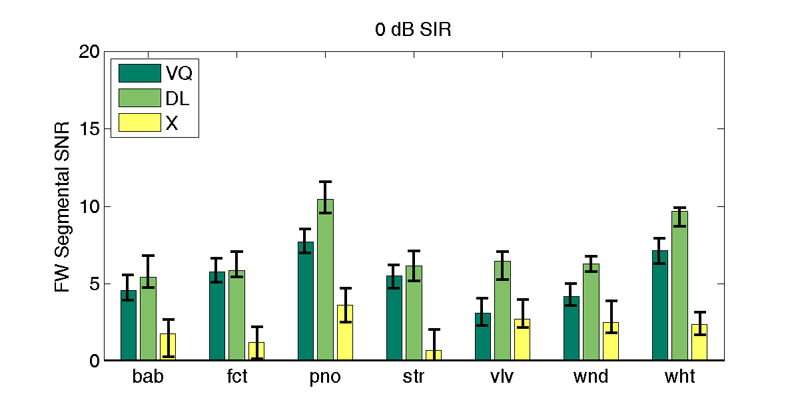
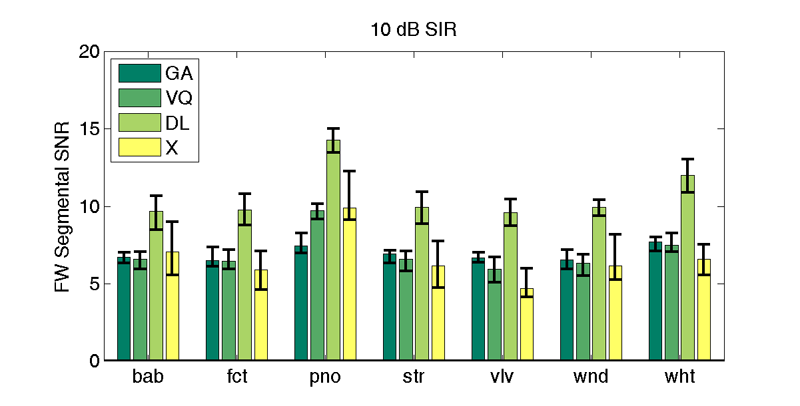 Enhancement performance for seven different interferers. The median fwSegSNR value
is denoted by the filled bar, while the whiskers denote the 25th and 75th percentiles of the distribution of
values.
Enhancement performance for seven different interferers. The median fwSegSNR value
is denoted by the filled bar, while the whiskers denote the 25th and 75th percentiles of the distribution of
values.
| 10 db SIR | |||||||
| Interferer | |||||||
| bab | fct | pno | str | vlv | wnd | wht | |
| GA | 6.4 | 6.6 | 7.8 | 6.5 | 6.9 | 6.2 | 7.7 |
| VQi | 6.6 | 6.5 | 9.7 | 6.6 | 5.9 | 6.3 | 7.5 |
| DLi | 9.7 | 9.7 | 14.3 | 9.9 | 9.6 | 9.9 | 12.0 |
| X | 7.1 (9.0) | 5.9 (7.1) | 9.9 (12.3) | 6.1 (7.7) | 4.7 (6.0) | 6.1 (8.2) | 6.6 (7.5) |
Corresponding numerical representation of the enhancement performance. The median fwSegSNR value is reported, along with the 75th percentile for degraded speech in parentheses. A significant improvement is denoted by setting the value in bold typeface.
| 10 db SIR | |||||||
| Interferer | |||||||
| bab | fct | pno | str | vlv | wnd | wht | |
| GA | wav | wav | wav | wav | wav | wav | wav |
| VQi | wav | wav | wav | wav | wav | wav | wav |
| DLi | wav | wav | wav | wav | wav | wav | wav |
| X | wav | wav | wav | wav | wav | wav | wav |
Example audio files, chosen as follows. For our method, the degraded speech file is chosen which resulted in an enhancement performance closest to the reported median performance, and its enhanced speech signal is provided in the row denoted by DL. For comparison, the same mixture is also enhanced using the comparison methods GA and VQ, and is provided in the respective rows. Finally, the unenhanced mixture signal is provided in the X row. For each interferer, the provided examples make it possible to compare the improvement and artefacts introduced by the enhancement algorithms on the same speech utterance.
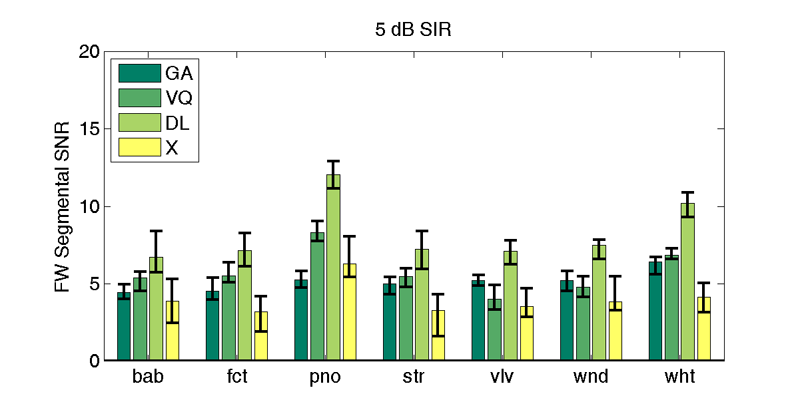
| 5 db SIR | |||||||
| Interferer | |||||||
| bab | fct | pno | str | vlv | wnd | wht | |
| GA | 4.1 | 4.6 | 5.4 | 4.8 | 5.4 | 4.8 | 6.2 |
| VQi | 5.4 | 5.5 | 8.3 | 5.5 | 4.0 | 4.8 | 6.8 |
| DLi | 6.7 | 7.1 | 12.0 | 7.2 | 7.1 | 7.5 | 10.2 |
| X | 3.9 (5.3) | 3.2 (4.2) | 6.3 (8.1) | 3.3 (4.3) | 3.5 (4.7) | 3.8 (5.5) | 4.1 (5.1) |
| 5 db SIR | |||||||
| Interferer | |||||||
| bab | fct | pno | str | vlv | wnd | wht | |
| GA | wav | wav | wav | wav | wav | wav | wav |
| VQi | wav | wav | wav | wav | wav | wav | wav |
| DLi | wav | wav | wav | wav | wav | wav | wav |
| X | wav | wav | wav | wav | wav | wav | wav |
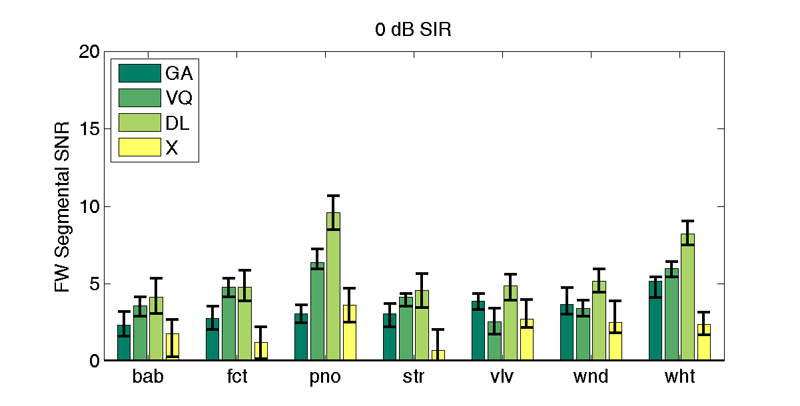
| 0 db SIR | |||||||
| Interferer | |||||||
| bab | fct | pno | str | vlv | wnd | wht | |
| GA | 2.4 | 2.6 | 3.2 | 3.0 | 4.0 | 3.5 | 4.9 |
| VQi | 3.6 | 4.8 | 6.4 | 4.1 | 2.6 | 3.4 | 6.0 |
| DLi | 4.1 | 4.8 | 9.6 | 4.6 | 4.9 | 5.2 | 8.2 |
| X | 1.8 (2.7) | 1.2 (2.2) | 3.6 (4.7) | 0.7 (2.0) | 2.7 (4.0) | 2.5 (3.9) | 2.4 (3.1) |
| 0 db SIR | |||||||
| Interferer | |||||||
| bab | fct | pno | str | vlv | wnd | wht | |
| GA | wav | wav | wav | wav | wav | wav | wav |
| VQi | wav | wav | wav | wav | wav | wav | wav |
| DLi | wav | wav | wav | wav | wav | wav | wav |
| X | wav | wav | wav | wav | wav | wav | wav |
Frequency-Weighted Segmental SNR - Speaker Dependent
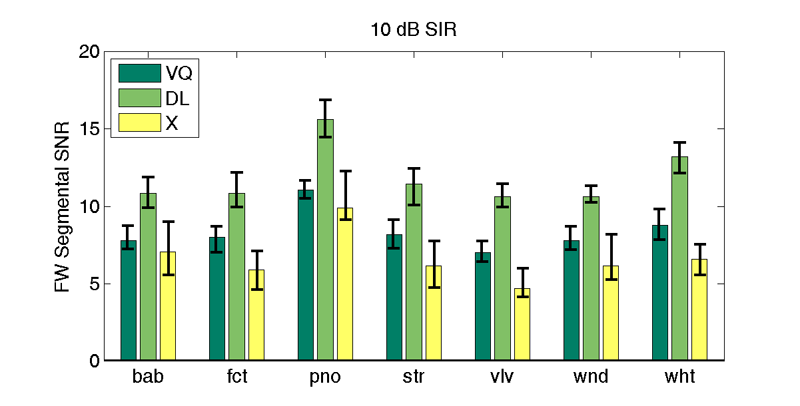
| 10 db SIR | |||||||
| Interferer | |||||||
| bab | fct | pno | str | vlv | wnd | wht | |
| VQd | 7.8 | 8.0 | 11.1 | 8.2 | 7.0 | 7.8 | 8.8 |
| DLd | 10.8 | 10.8 | 15.6 | 11.4 | 10.6 | 10.6 | 13.2 |
| X | 7.1 (9.0) | 5.9 (7.1) | 9.9 (12.3) | 6.1 (7.7) | 4.7 (6.0) | 6.1 (8.2) | 6.6 (7.5) |
| 10 db SIR | |||||||
| Interferer | |||||||
| bab | fct | pno | str | vlv | wnd | wht | |
| VQd | wav | wav | wav | wav | wav | wav | wav |
| DLd | wav | wav | wav | wav | wav | wav | wav |
| X | wav | wav | wav | wav | wav | wav | wav |
| 5 db SIR | |||||||
| Interferer | |||||||
| bab | fct | pno | str | vlv | wnd | wht | |
| VQd | 6.4 | 6.8 | 9.4 | 6.9 | 4.7 | 6.0 | 8.0 |
| DLd | 8.2 | 8.3 | 13.0 | 8.8 | 8.4 | 8.4 | 11.3 |
| X | 3.9 (5.3) | 3.2 (4.2) | 6.3 (8.1) | 3.3 (4.3) | 3.5 (4.7) | 3.8 (5.5) | 4.1 (5.1) |
| 5 db SIR | |||||||
| Interferer | |||||||
| bab | fct | pno | str | vlv | wnd | wht | |
| VQd | wav | wav | wav | wav | wav | wav | wav |
| DLd | wav | wav | wav | wav | wav | wav | wav |
| X | wav | wav | wav | wav | wav | wav | wav |
| 0 db SIR | |||||||
| Interferer | |||||||
| bab | fct | pno | str | vlv | wnd | wht | |
| VQd | 4.6 | 5.8 | 7.7 | 5.5 | 3.1 | 4.2 | 7.2 |
| DLd | 5.4 | 5.9 | 10.5 | 6.2 | 6.4 | 6.3 | 9.7 |
| X | 1.8 (2.7) | 1.2 (2.2) | 3.6 (4.7) | 0.7 (2.0) | 2.7 (4.0) | 2.5 (3.9) | 2.4 (3.1) |
| 0 db SIR | |||||||
| Interferer | |||||||
| bab | fct | pno | str | vlv | wnd | wht | |
| VQd | wav | wav | wav | wav | wav | wav | wav |
| DLd | wav | wav | wav | wav | wav | wav | wav |
| X | wav | wav | wav | wav | wav | wav | wav |
PESQ - Speaker Independent
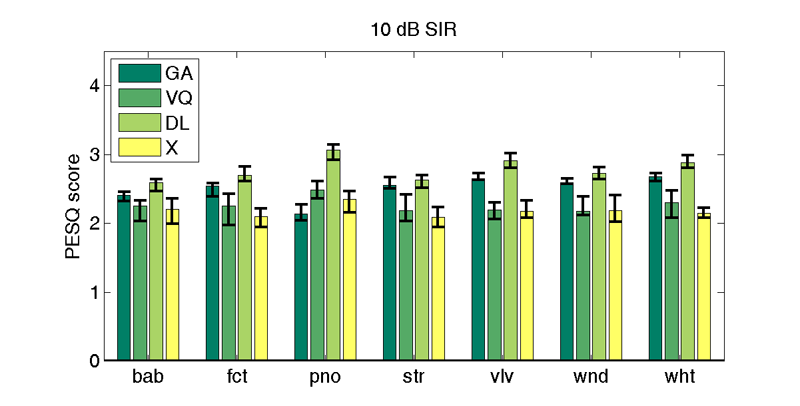
| 10 db SIR | |||||||
| Interferer | |||||||
| bab | fct | pno | str | vlv | wnd | wht | |
| GA | 2.4 | 2.5 | 2.1 | 2.5 | 2.5 | 2.5 | 2.6 |
| VQi | 2.3 | 2.3 | 2.5 | 2.2 | 2.2 | 2.2 | 2.3 |
| DLi | 2.6 | 2.7 | 3.1 | 2.6 | 2.9 | 2.7 | 2.9 |
| X | 2.2 (2.4) | 2.1 (2.2) | 2.4 (2.5) | 2.1 (2.2) | 2.2 (2.3) | 2.2 (2.4) | 2.1 (2.2) |
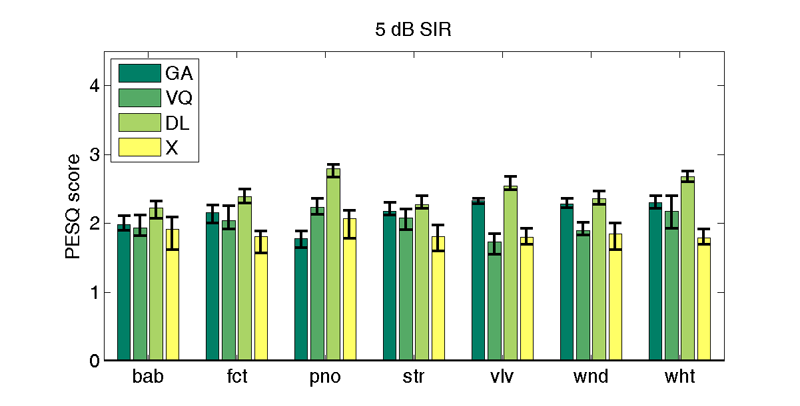
| 5 db SIR | |||||||
| Interferer | |||||||
| bab | fct | pno | str | vlv | wnd | wht | |
| GA | 2.0 | 2.1 | 1.7 | 2.1 | 2.2 | 2.2 | 2.3 |
| VQi | 1.9 | 2.0 | 2.2 | 2.1 | 1.7 | 1.9 | 2.2 |
| DLi | 2.2 | 2.4 | 2.8 | 2.3 | 2.5 | 2.4 | 2.7 |
| X | 1.9 (2.1) | 1.8 (1.9) | 2.1 (2.2) | 1.8 (2.0) | 1.8 (1.9) | 1.9 (2.0) | 1.8 (1.9) |
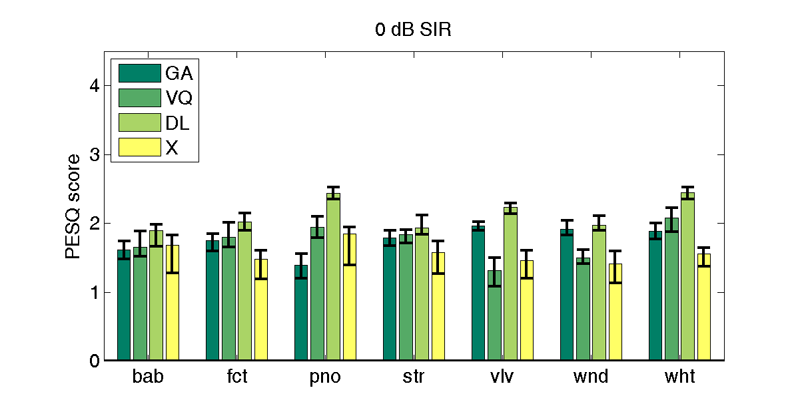
| 0 db SIR | |||||||
| Interferer | |||||||
| bab | fct | pno | str | vlv | wnd | wht | |
| GA | 1.6 | 1.7 | 1.3 | 1.8 | 1.9 | 1.9 | 1.9 |
| VQi | 1.7 | 1.8 | 1.9 | 1.8 | 1.3 | 1.5 | 2.1 |
| DLi | 1.9 | 2.0 | 2.4 | 1.9 | 2.2 | 2.0 | 2.4 |
| X | 1.7 (1.8) | 1.5 (1.6) | 1.8 (1.9) | 1.6 (1.7) | 1.5 (1.6) | 1.4 (1.6) | 1.6 (1.6) |
PESQ - Speaker Dependent
| 10 db SIR | |||||||
| Interferer | |||||||
| bab | fct | pno | str | vlv | wnd | wht | |
| VQd | 2.4 | 2.4 | 2.7 | 2.4 | 2.4 | 2.4 | 2.5 |
| DLd | 2.7 | 2.8 | 3.2 | 2.8 | 3.0 | 2.8 | 2.9 |
| X | 2.2 (2.4) | 2.1 (2.2) | 2.4 (2.5) | 2.1 (2.2) | 2.2 (2.3) | 2.2 (2.4) | 2.1 (2.2) |
| 5 db SIR | |||||||
| Interferer | |||||||
| bab | fct | pno | str | vlv | wnd | wht | |
| VQd | 2.1 | 2.2 | 2.4 | 2.2 | 1.9 | 2.1 | 2.3 |
| DLd | 2.4 | 2.5 | 2.9 | 2.4 | 2.6 | 2.5 | 2.7 |
| X | 1.9 (2.1) | 1.8 (1.9) | 2.1 (2.2) | 1.8 (2.0) | 1.8 (1.9) | 1.9 (2.0) | 1.8 (1.9) |
| 0 db SIR | |||||||
| Interferer | |||||||
| bab | fct | pno | str | vlv | wnd | wht | |
| VQd | 1.8 | 2.0 | 2.1 | 2.0 | 1.4 | 1.7 | 2.1 |
| DLd | 2.0 | 2.1 | 2.6 | 2.1 | 2.3 | 2.1 | 2.5 |
| X | 1.7 (1.8) | 1.5 (1.6) | 1.8 (1.9) | 1.6 (1.7) | 1.5 (1.6) | 1.4 (1.6) | 1.6 (1.6) |
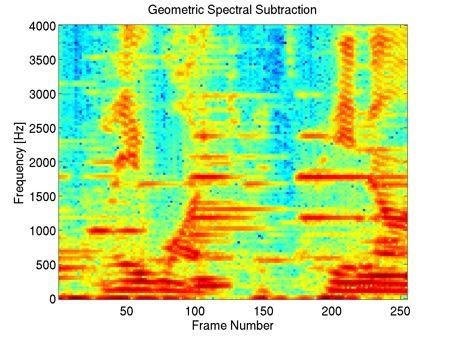
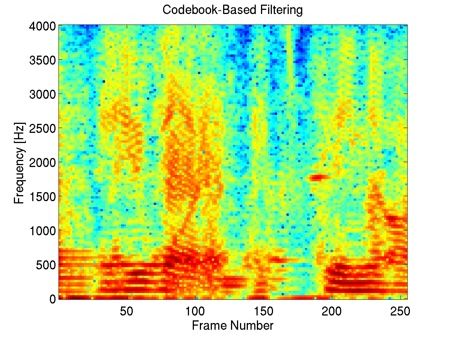
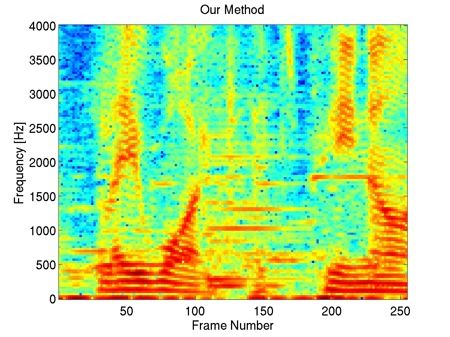
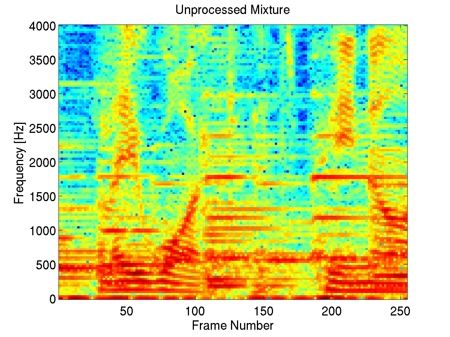
Example Spectrograms
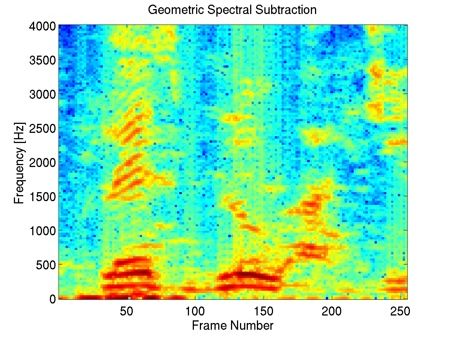
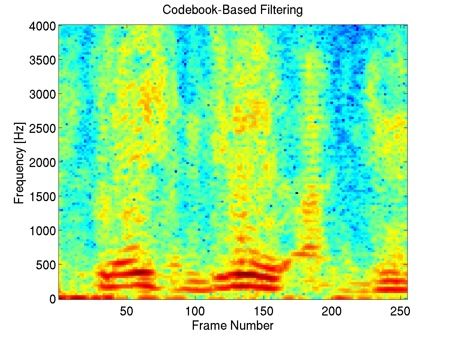
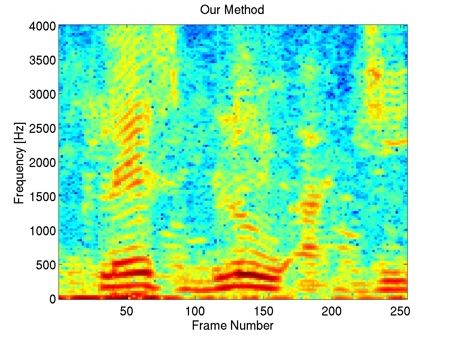
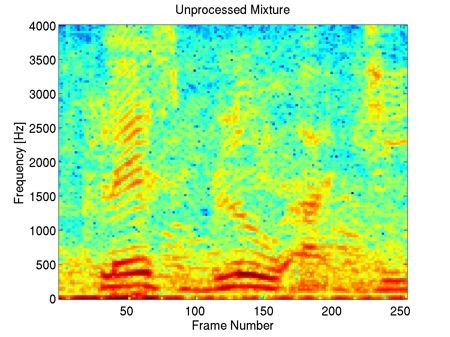
"bab" Interferer, +10dB SIR
This example shows that our method preserves most of the harmonic content of the underlying clean speech in the enhancement, including the fine harmonic structures in the higher frequencies. In comparison, geometric spectral subtraction performs a somewhat more agressive processing. While the low frequency harmonic structures are preserved, much of the high frequency structures of speech are lost. Codebook-based filtering destroys most of the mid and high frequency harmonic structures and only preserves the most pronounced, low-frequency ones.
"fct" Interferer, +05dB SIR
This example illustrates that codebook-based filtering can introduce mid and high-frequency artefacts not present in the unprocessed mixture, e.g. at frames 20 to 30. Geometric spectral subtraction again preserves less of the finer harmonic structure of the underlying clean speech, compared to our method.
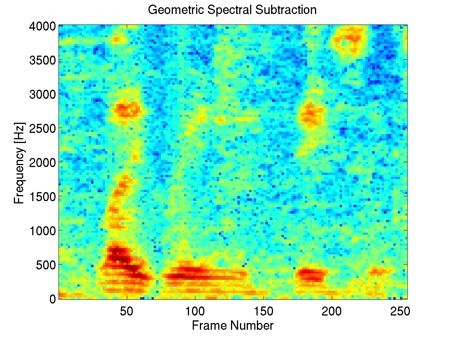
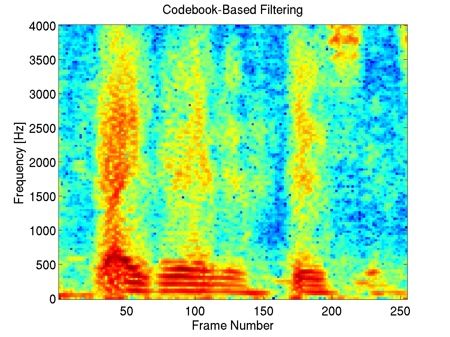
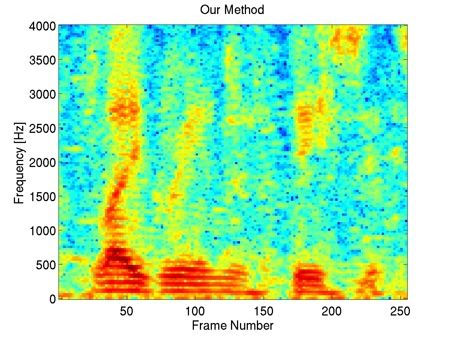
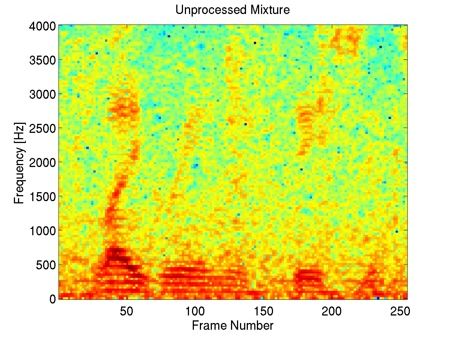
"pno" Interferer, +00dB SIR
In this example with a piano music interferer, one can see that many piano notes (seen as horizontal high-energy lines in the spectrogram) are still present in the geometric spectral subtraction processed signal, whereas some of the finer harmonic structure of speech is lost. In contrast, our method is able to preserve more of the harmonic structure of speech, while also attenuating more of the interfering piano notes. Codebook-based filtering attenuates most of the piano notes, however the method again introduces strong artifacts, for example seen in frames 70 to 120.
Downloads
Matlab and MEX implementations of the LARC sparse coding algorithm: larc-0.1.zip