Non-Negative Sparse PCA Comparison
2013-09-15Version 0.4 of the nsprcomp package brings several improvements:
-
The various deflation methods have been replaced with generalized deflation (Mackey, 2009), which directly optimizes the additional variance explained by each component. Implementing generalized deflation required changes to the inner EM loop, and I was unsure at first whether they could be made efficient for high dimensional data. Fortunately, there is only a small constant increase in computational complexity.
-
nscumcompincludes a variational re-normalization step (i.e. recomputing the loadings given the support of the pseudo-rotation matrix), which improves the explained variance quite a bit. -
Both
nsprcompandnscumcompreturn the additional explained standard deviation of each component. This is identical to standard PCA for an orthogonal rotation matrix, but avoids double counting of explained variance for principal axes which are not pairwise orthogonal. See theasdevfunction documentation for details.
A comparison on the marty data from the
EMA package illustrates the
relative performance of sparse PCA methods with R
implementations. This data matrix contains \(N=23\) expression profiles for
\(D=54613\) genes, and thus explores the \(N \ll D\) case. The three
methods considered are nsprcomp and nscumcomp, and arrayspc from
the elasticnet package
(version 1.1). PCAgrid from the
pcaPP package has problems
with long vectors in version 1.9-49 under R 3.0.1 and therefore could
not be included in this comparison.
Sequential PCA
arrayspc expects a penalty associated with the \(L_1\) norm of the
principal axis as the sparsity argument para (where large penalties
lead to sparse solutions). I therefore first ran arrayspc with a
constant penalty for all components, measured the cardinalities of the
resulting principal axes and used those as the sparsity argument k
for nsprcomp.

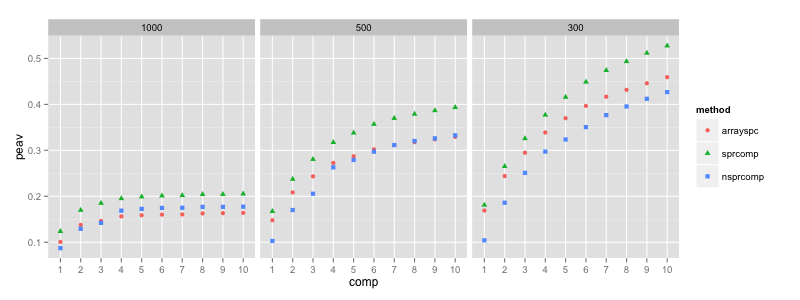
The figure plots the cumulative percentage explained additional
variance (see ?peav) w.r.t. the number of components, for an \(L_1\) norm
penalty of 1000, 500 and 300, respectively. The number of components
was set to 10 in all experiments. “sprcomp” (green triangle) is the
result for sparse PCA using nsprcomp, and “nsprcomp” (blue square)
is the result for non-negative sparse PCA using nsprcomp. para = 1000 results in cardinalities between 1 and 2823, for para = 300
the cardinalities range between 1716 and 15328. As expected, enforcing
additional non-negativity of the loadings resulted in less explained
variance.
Cumulative PCA
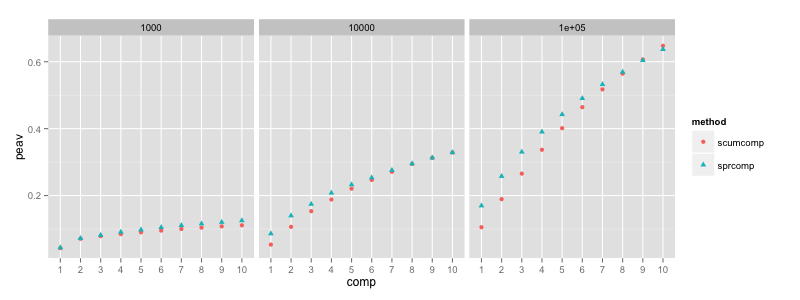
The comparison of sequential and cumulative methods follows along
similar lines. I specified the total sum of all cardinalities as the
sparsity argument k to nscumcomp, measured the cardinalities of
the resulting principal axes and used those as the sparsity argument
for nsprcomp. The number of components was again set to ncomp = 10.

The greedy optimization of nsprcomp (denoted “sprcomp” for sparse
PCA) achieves more explained variance for the first components, but
its curve also saturates more quickly for the latter components. The
nscumcomp curve is more linear, and the total explained variance of
both methods is therefore comparable.
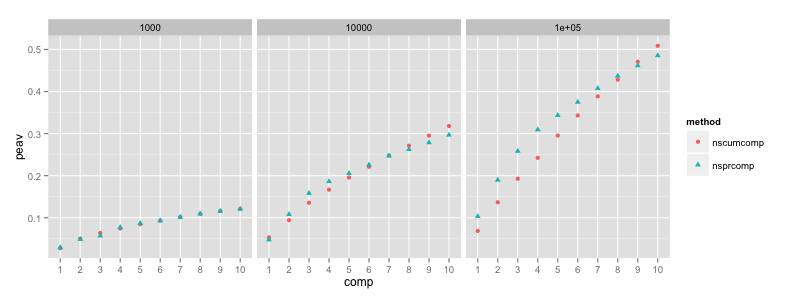
Including the non-negativity constraint gives similar results:

The difference between greedy and joint optimization of the principal
axes is most pronounced for k = 1e5. Here, the “nsprcomp” curve
saturates so quickly that the almost linear “nscumcomp” curve achieves
more explained total variance (this effect would be even greater if
ncomp was increased beyond ten). As expected, the additional
non-negativity constraint results in less cumulative explained
variance overall.
Conclusion
The comparison demonstrates that both nsprcomp and nscumcomp can
be used fruitfully to analyze high dimensional data such as gene
expression profiles. The explained variance depends on the choice of
the constraints and the goal (sequential versus joint analysis), but
is comparable between both algorithms and competitive
with respect to arrayspc.
References
L. W. Mackey (2009). Deflation Methods for Sparse PCA. Advances in Neural Information Processing Systems, Vol. 21.